
Goal: In this tutorial you will learn how to generate 3D city models from open data using extrusion and the open-source software 3dfier.
Introduction to extrusion
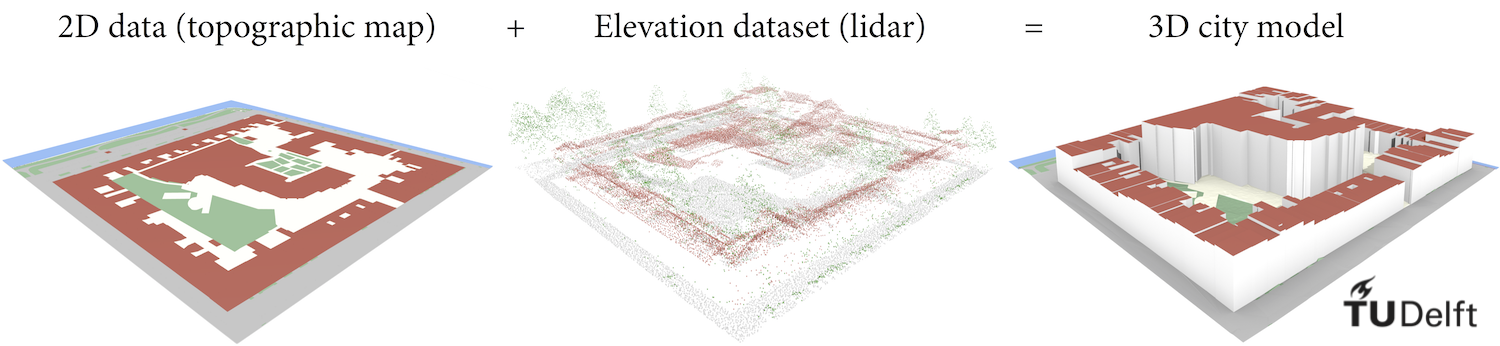
One popular way to generate 3D city models is extrusion: features from a 2D dataset such as a cadastral database, are lifted to a single height, creating volumetric 3D city models. The heights are usually obtained from laser scanning (e.g. the average elevation of all points within a footprint), from a cadastral database, or from volunteered geoinformation (e.g. using the number of floors). The first case is illustrated:
This is method is simple and straightforward. The resulting 3D city models, while simple (they have flat tops; the so-called LOD1 models), offer much advantantage over 2D datasets. For example, they may be used for shadow analyses and line of sight predictions.
However, there are some challenges to be aware of, e.g. errors in the 2D data propagate to the generated 3D model, while simple this method is not followed by many implementations, and because point clouds are usually large the calculation of height of each feature may be quite slow.
Here at the 3D geoinformation group at TU Delft we have developed 3dfier for creating 3D models. In this tutorial we will briefly demonstrate how to generate a 3D model with it, using open data.
Installation of the software
The software is command-line, that is, it doesn’t have a graphical interface.
However, it is still very simple to use.
The first step is to install it following the installation instructions.
To test whether you installed it correctly, just run ./3dfier and you should get something like this:
$ ./3dfier
3dfier Copyright (C) 2015-2019  3D geoinformation research group, TU Delft
This program comes with ABSOLUTELY NO WARRANTY.
This is free software, and you are welcome to redistribute it
under certain conditions; for details run 3dfier with the '--license' option.

ERROR: one YAML config file must be specified.

Allowed options:
  --help                        View all options
  --version                     View version
  --license                     View license
  --OBJ arg                     Output
  --OBJ-NoID arg                Output
  --CityGML arg                 Output
  --CityGML-Multifile arg       Output
  --CityGML-IMGeo arg           Output
  --CityGML-IMGeo-Multifile arg Output
  --CityJSON arg                Output
  --CSV-BUILDINGS arg           Output
  --CSV-BUILDINGS-MULTIPLE arg  Output
  --CSV-BUILDINGS-ALL-Z arg     Output
  --Shapefile arg               Output
  --Shapefile-Multifile arg     Output
  --PostGIS arg                 Output
  --PostGIS-PDOK arg            Output
  --PostGIS-PDOK-CityGML arg    Output
  --GDAL arg                    Output
Short overview of 3dfier
3dfier requires one or more 2D datasets and one or more elevation datasets as input. The 2D datasets can be of any OGR format, such as SHP or GML. The elevation datasets will be in LAS/LAZ.
Besides defining input datasets, 3dfier enables defining certain parameters such as point cloud thinning.
All these are defined in a single text file with the .yml extension.
For example, if you have building footprints in a separate 2D file this is how the input will look like:
input_polygons:
    datasets:
      - bgt/bgt_pand.sqlite
    uniqueid: gml_id
    lifting: Building
Don’t worry, 3dfier comes with a prepared sample config file, which you can edit to adapt to your case.
Generating your own dataset
After downloading the software you may have noticed that there is a directory called example_data. It contains everything you need to create a sample 3D city model which we will use in this short tutorial.
The configuration file testarea_config.yml is prepared with all the required information.
First familiarise yourself with the input datasets.
In this example for 2D data we will use BGT, that is, the Dutch large-scale topographic map. BGT is open data courtesy of Kadaster, the national mapping agency of the Netherlands.
The folder bgt contains the 2D dataset in multiple files. The area we will work on is the centre of Delft (you can use the free QGIS to view the files):
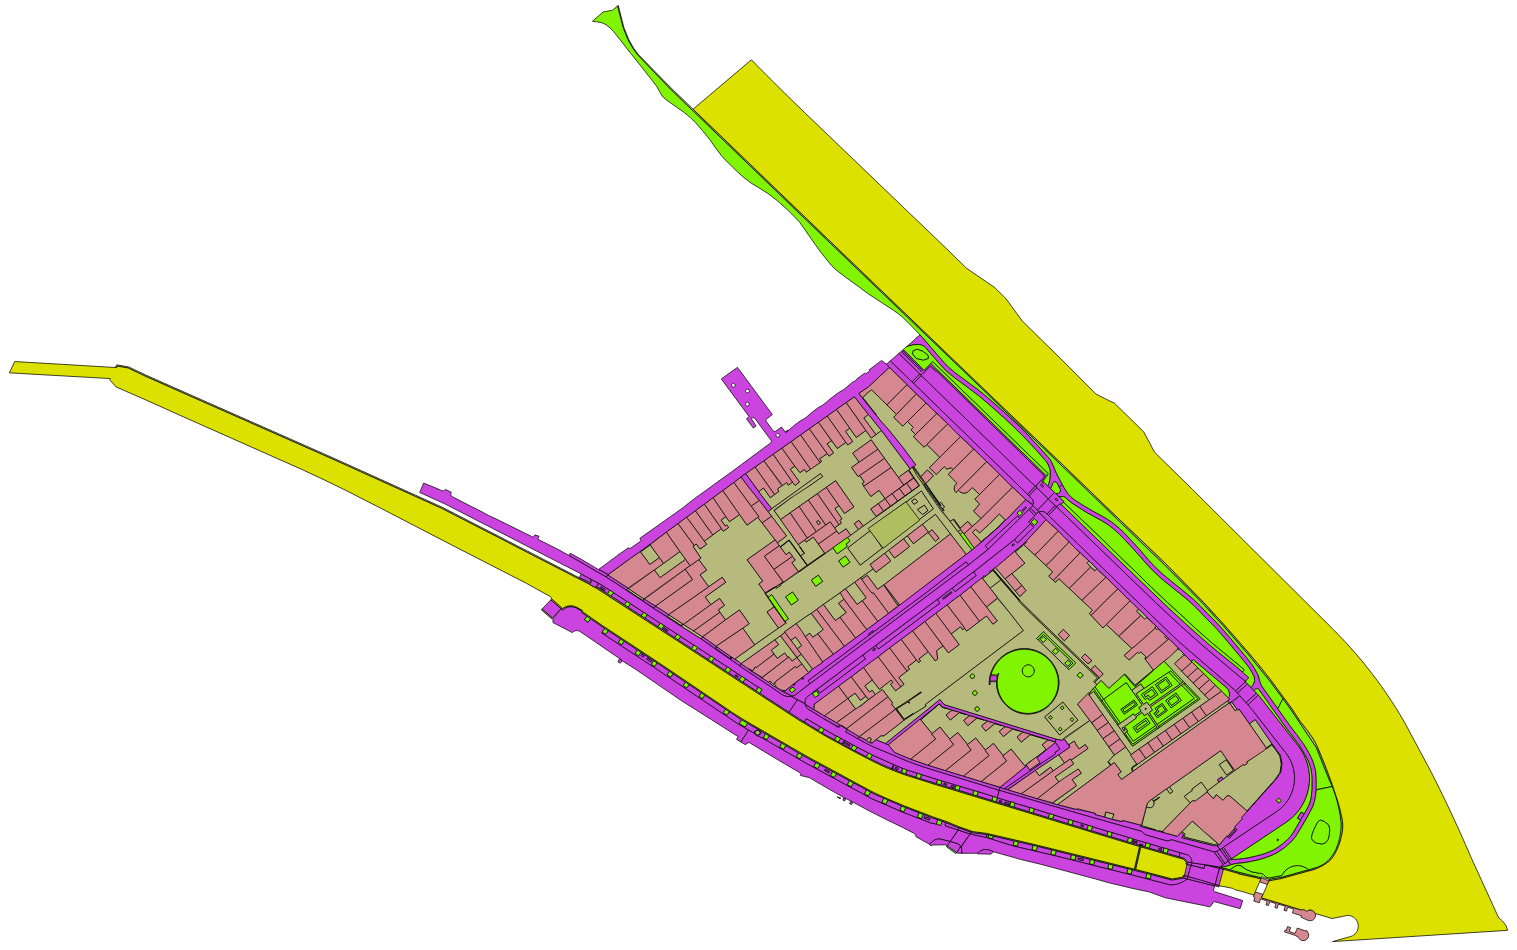
So the 2D dataset contains not only buildings, but also other features such as water, roads, and vegetation.
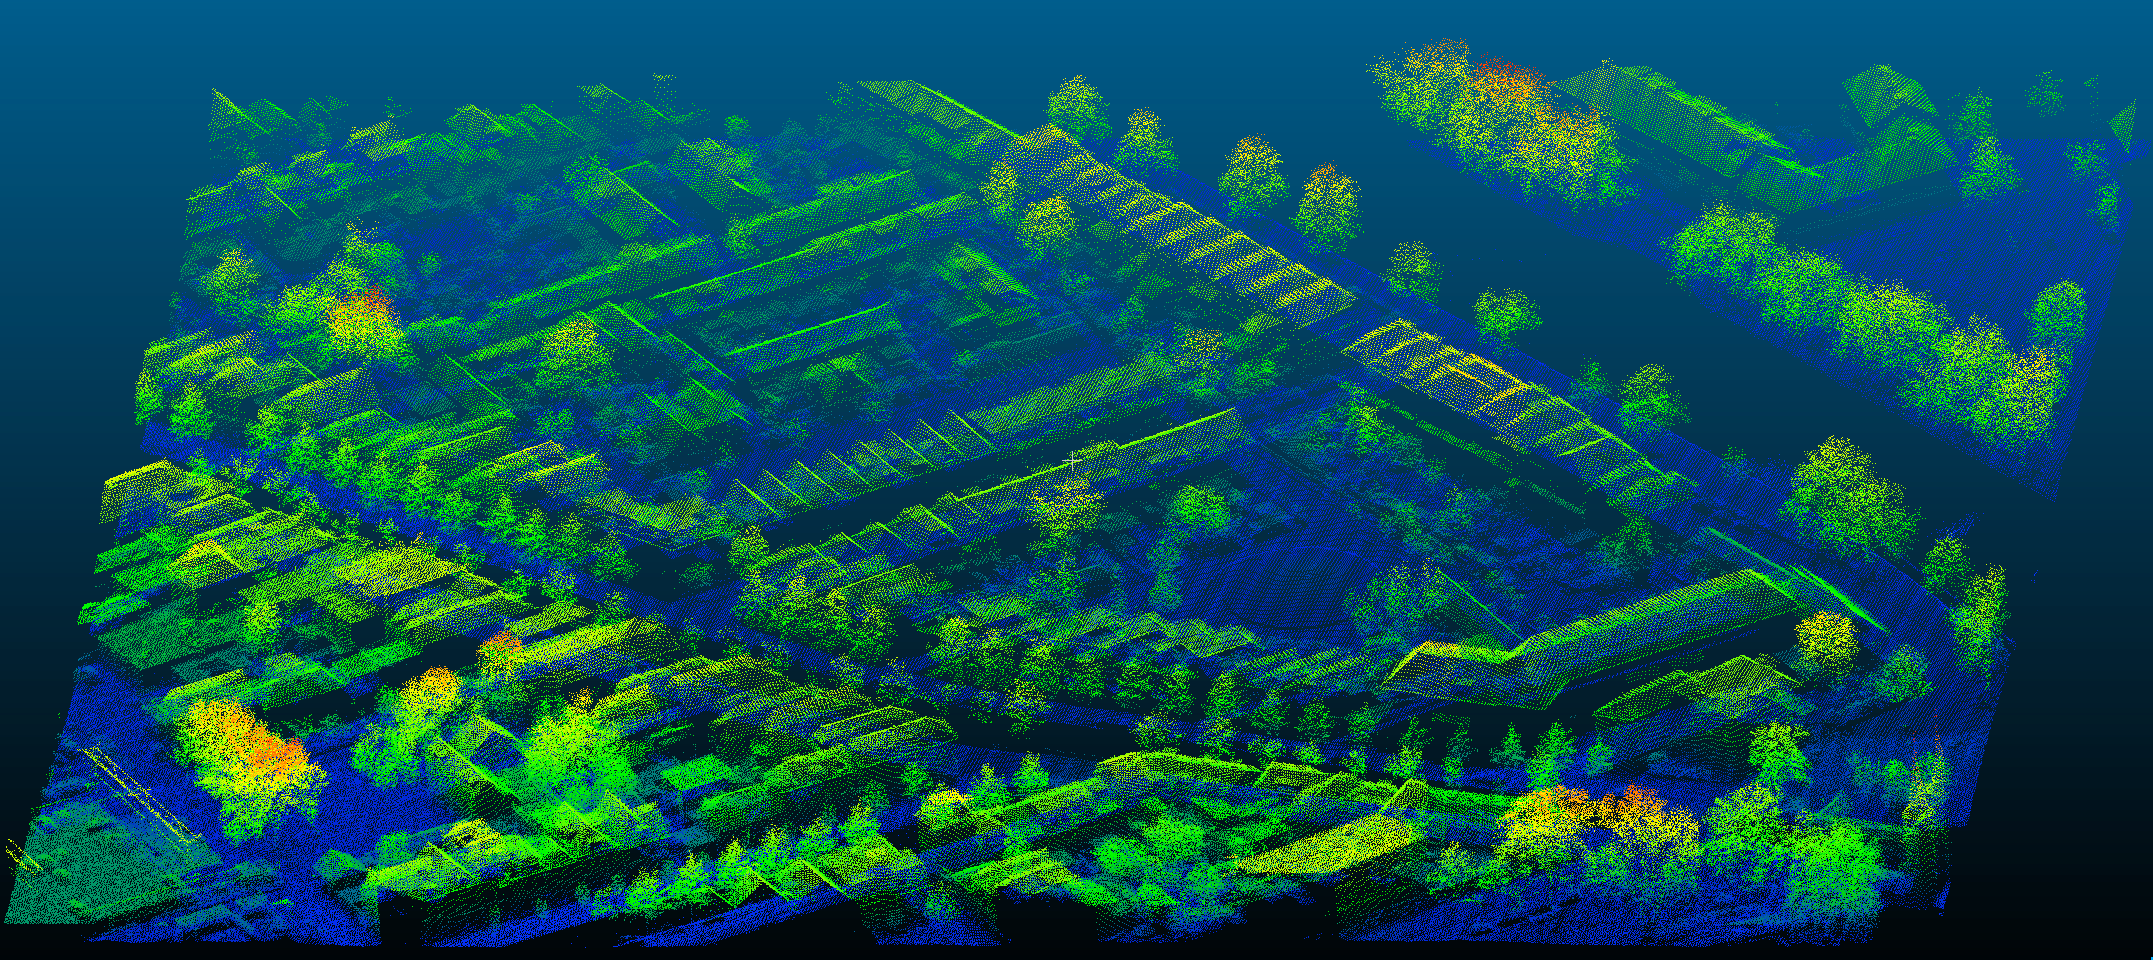
For the elevation we will use the National height model of the Netherlands (AHN). It is available as open data as well.
The area comes in two files, both stored in the folder ahn3. Here is how the point cloud looks like (you can use the free software CloudCompare for this):
The information about the input point clouds is noted in the configuration file as well:
input_elevation:
  - datasets:
      - ahn3/ahn3_cropped_1.laz
      - ahn3/ahn3_cropped_2.laz
    omit_LAS_classes:
      - 1 # unclassified
    thinning: 0
Notice that in the configuration file you can also specify omitting certain classes in the point cloud (such as vegetation) and thinning the points to speed up the process. These two lidar files are small, hence we will take into account all lidar points.
Now that you have checked the input datasets, let’s have a look at some other options of 3dfier. One important option is to specify how the elevation of the top of each building is determined. In our case:
lifting_options:
  Building:
    roof:
        height: percentile-90
    ground:
        height: percentile-10
the elevation of the ‘roof’ is at the 90th percentile of the elevation of all points that are within the building footprint.
This should roughly correspond to the elevation of the top of the building (a value of 90 percentile is given to filter out outliers and features such as chimneys).
The elevation of the bottom (that is, the ground plate) is at the 10th percentile.
You can play with these values and determine what works best for you.
Some people prefer to rather use height_roof: percentile-50 to get the height of the top at the median of all points.
Another important option is the format of the resulting 3D city model. The options are shown above at Installation of the software. The option is passed as a command line argument.
3dfier offers CityJSON, OBJ, and many more formats. OBJ is widely supported by 3D computer graphics software, so you can create a nice render of the 3D model:
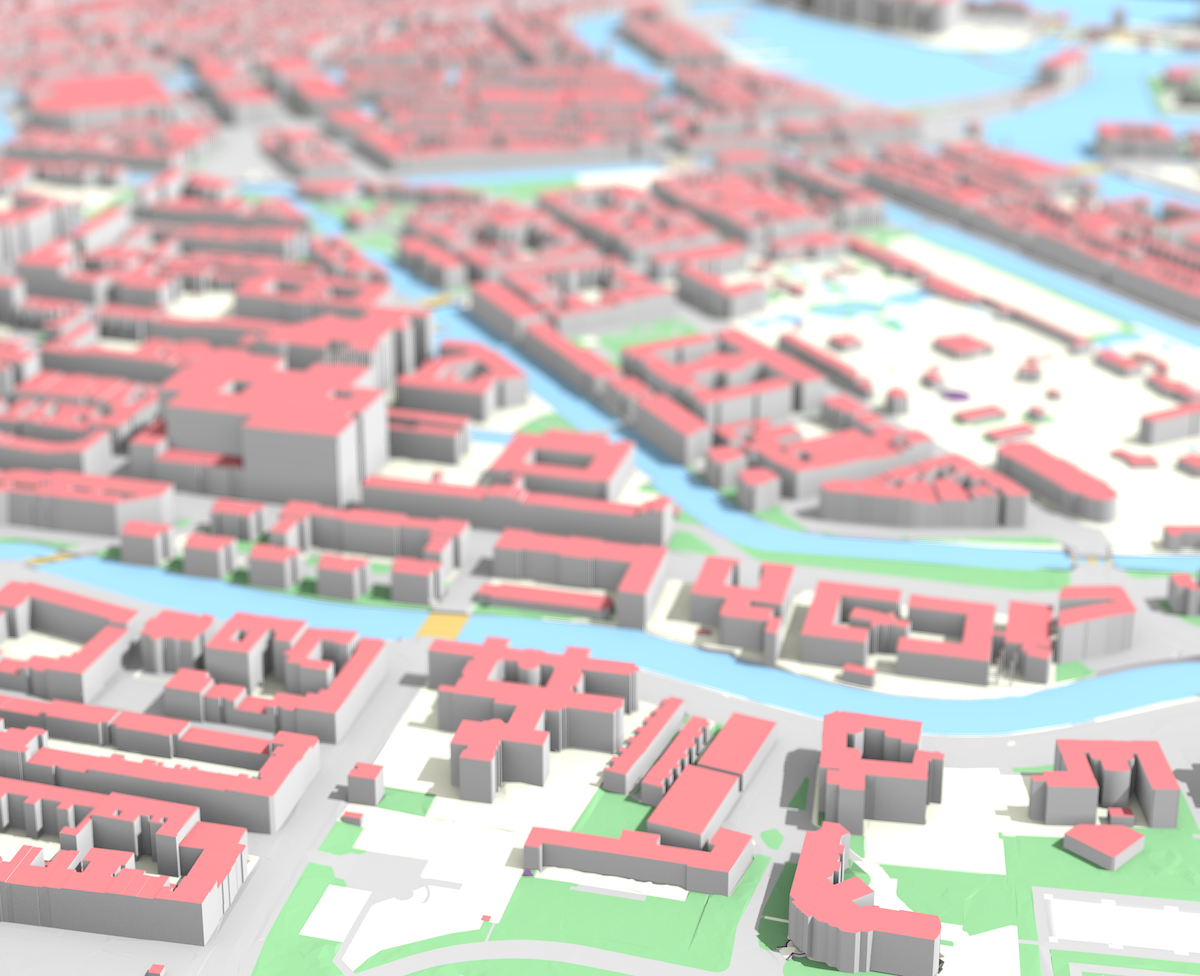
On the other hand, CityJSON is a powerful 3D GIS format, enabling spatial analyses and structuring of objects.
Now we are ready to generate the 3D model, both in CityJSON and OBJ. Generating the 3D model requires only one simple command:
3dfier testarea_config.yml --OBJ output/testarea.obj --CityJSON output/testarea.json
3dfier will report on the process of the 3D generation, but overall for this example it should not take more than half a minute.
If everything went well with the input data, the file should be available in the directory where you specified it (in our case in /output).
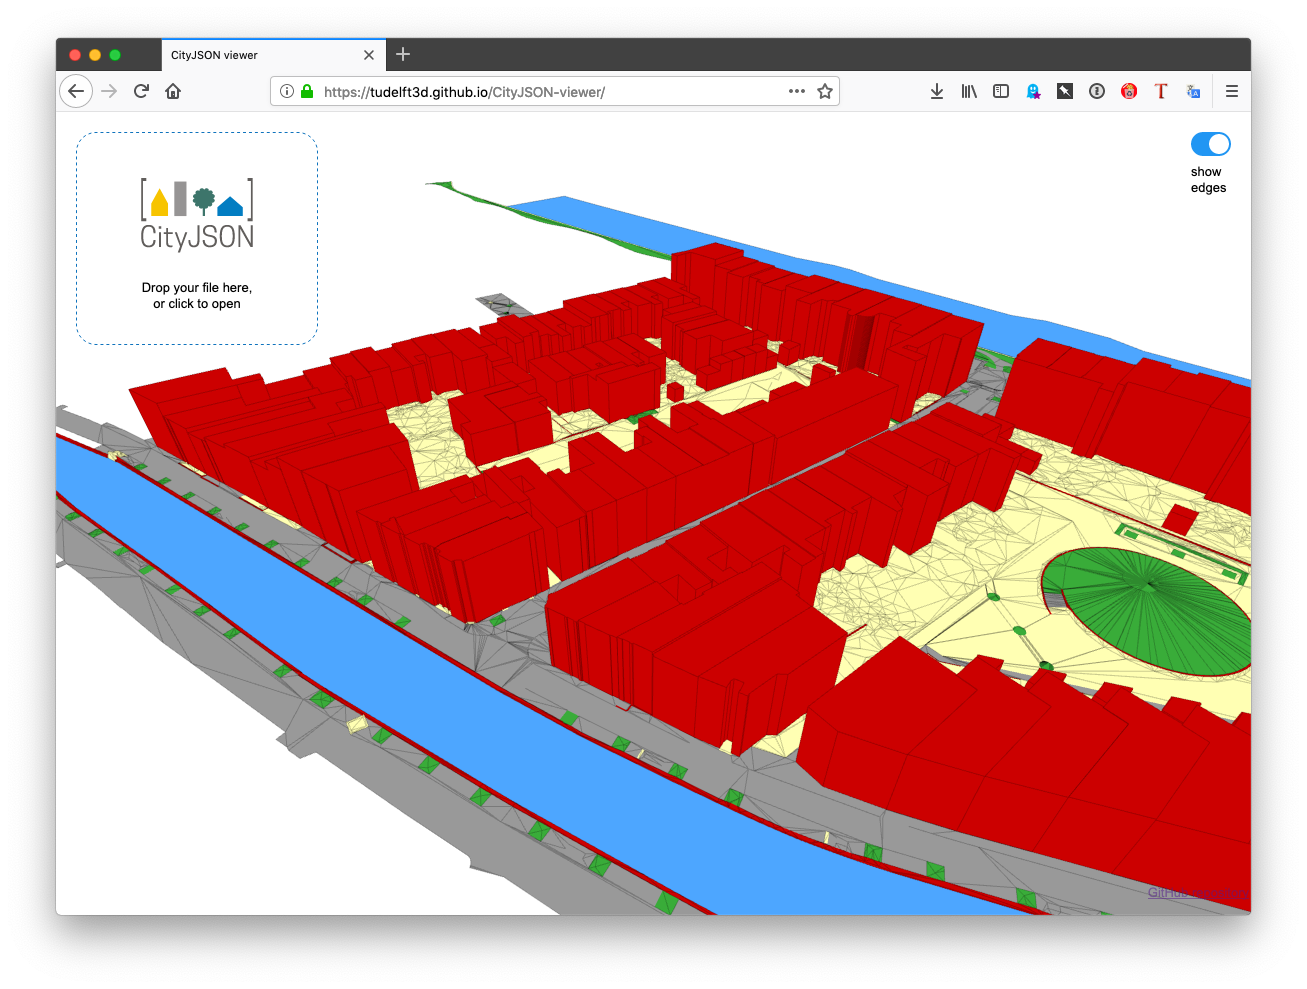
If you generated an OBJ you can view it with the free software MeshLab. If you opted for CityJSON you can visualise it with our CityJSON web-viewer.
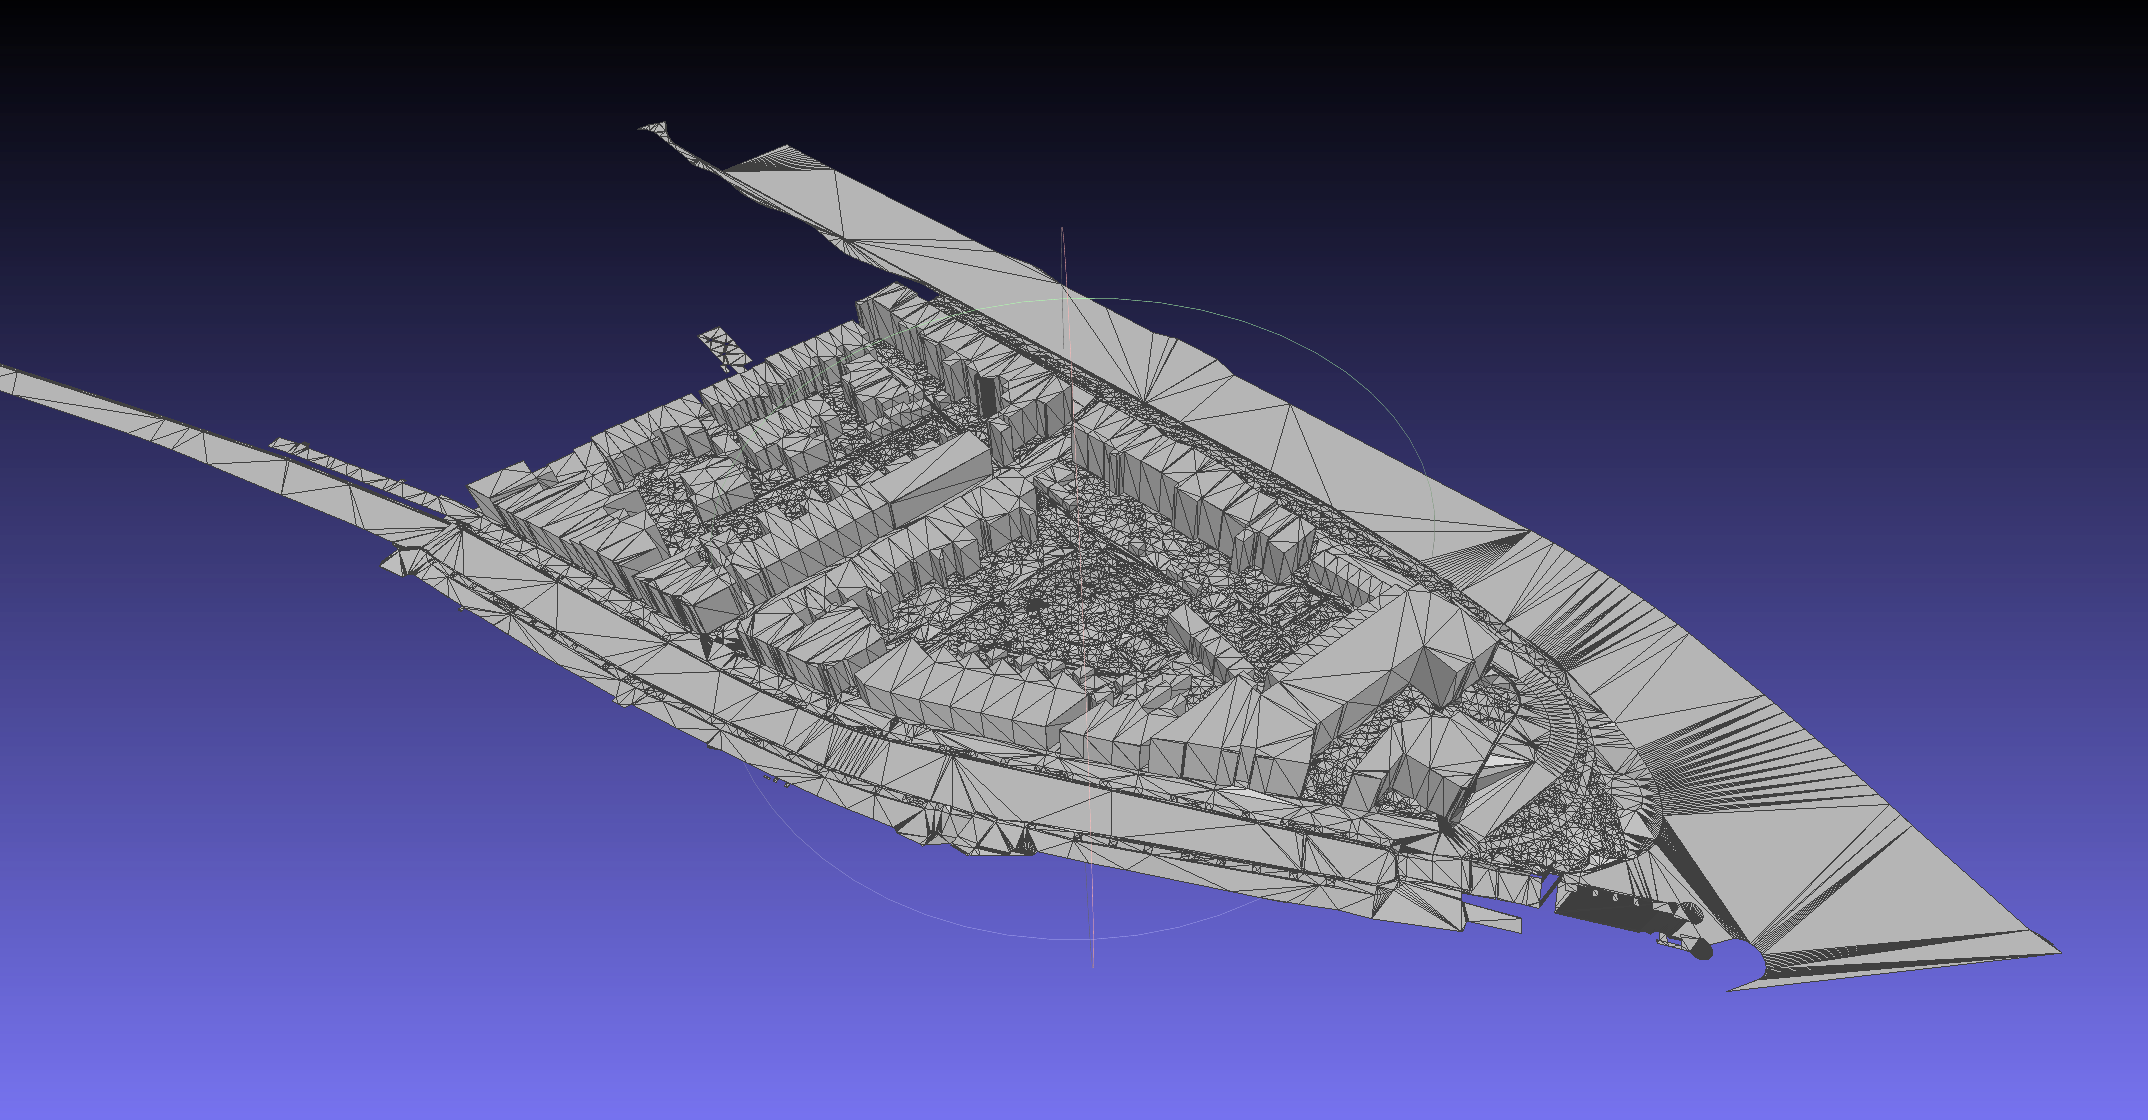
An OBJ is composed of triangles, so the result will look like this:
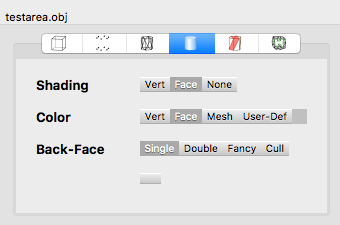
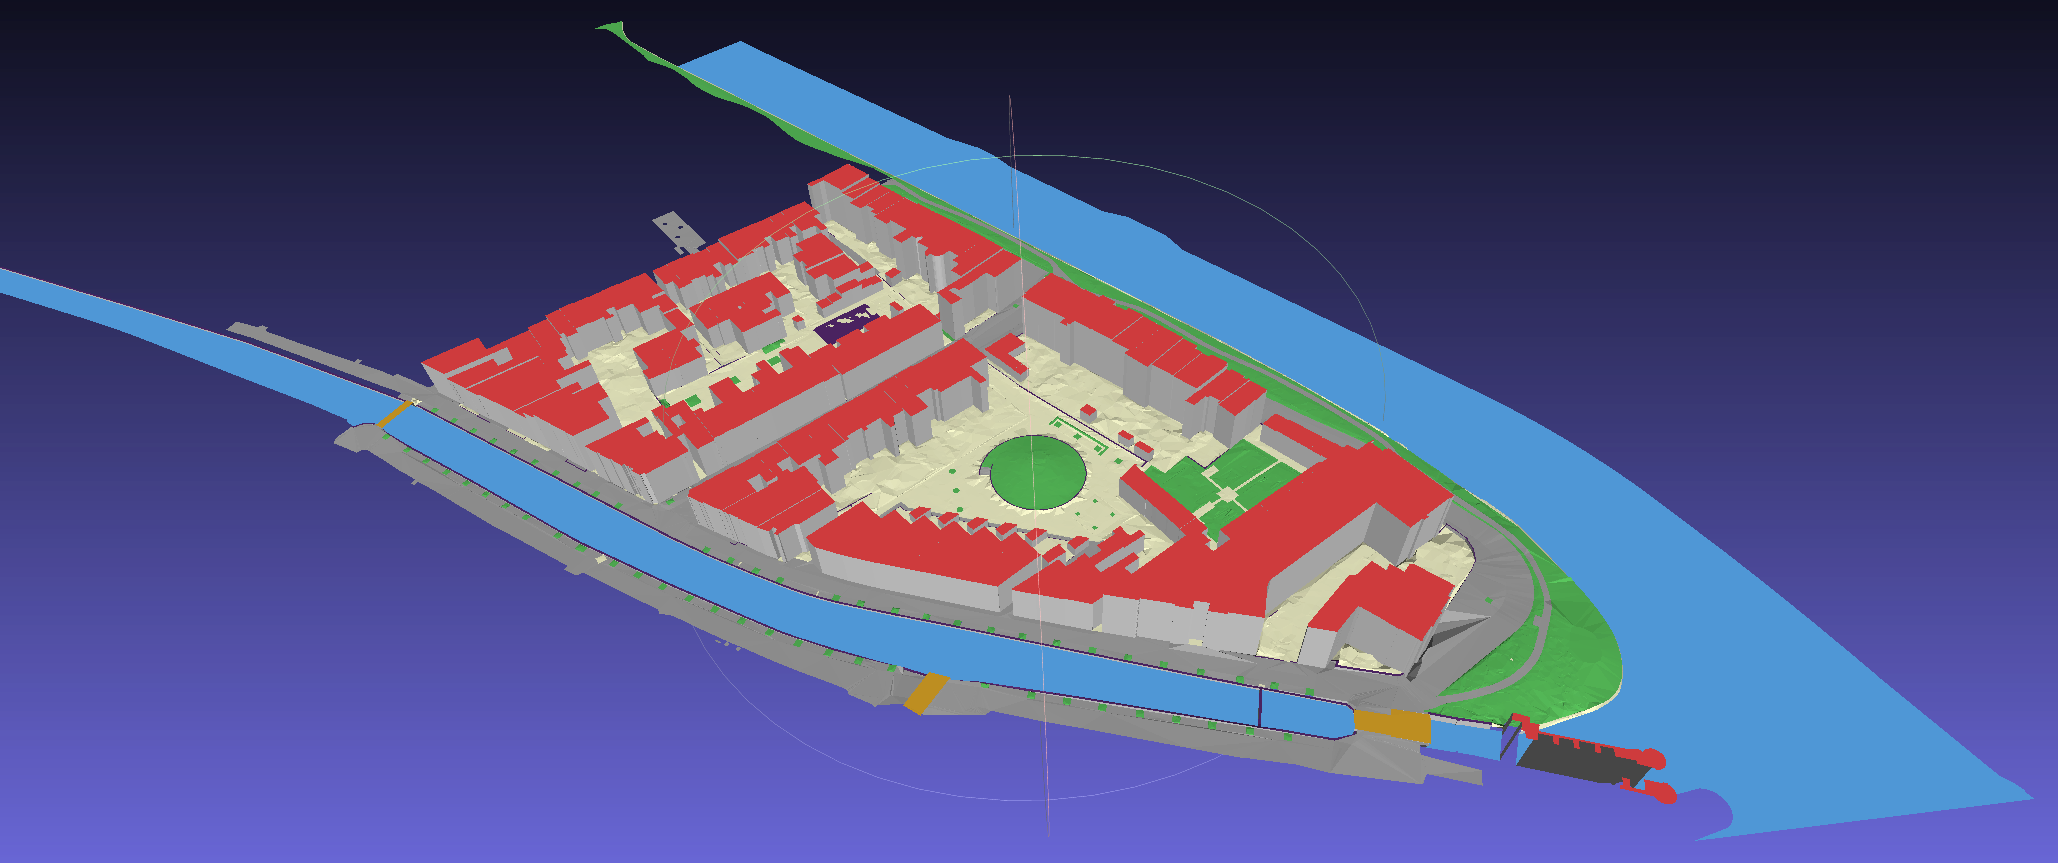
3dfier also comes with a material file, so if you switch the corresponding options in MeshLab you can visualise different semantic classes:
CityJSON looks similar:
Congratulations, you have created a 3D city model!
Try it with your own data
Now that you have familiarised yourself with 3dfier, you can try to generate a 3D city model with your own data. Let us know if you generate a nice dataset so we can showcase it on our website.