LaTeX Figures, tables, and flowcharts
Figures
Important
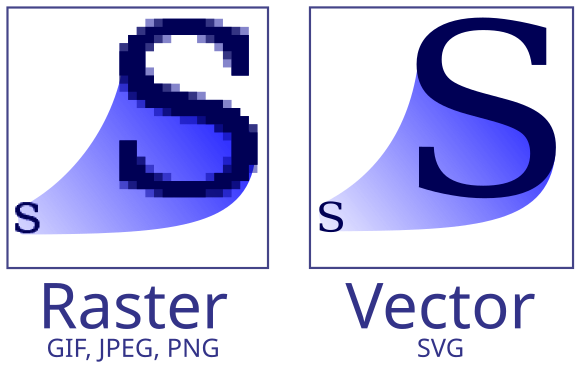
Make sure your figures are vector when possible, and not raster. This will make them of greater quality, especially for text.
Vector formats: PDF, SVG.
Raster formats: PNG, JPG, JPEG, GIF.
Best vector graphics drawing tools:
- Affinity Designer (€€ but way less than Adobe)
- Inkscape
- IPE (integrates LaTeX text; great for triangulation and geometric stuff)
- Adobe Illustrator (nice, but €€€)
Tables
Tables are notoriously difficult to make in LaTeX.
Tip
LaTeX package booktabs is strongly recommended!
The package \texttt{booktabs} permits you to make nicer tables than the basic ones in \LaTeX.
See for instance \autoref{tab:example}.

\usepackage{booktabs}
...
\begin{table}
  \centering
  \begin{tabular}{@{}lrrcrrc@{}} \toprule
    & \multicolumn{2}{c}{3D model} && \multicolumn{2}{c}{input} \\
    \cmidrule{2-3}  \cmidrule{5-6}
    & solids & faces && vertices & constraints  \\
    \toprule
    \textbf{campus}  & 370   & 4~298  && 5~970  & 3~976   \\
    \textbf{kvz}     & 637   & 6~549  && 8~951  & 13~571  \\
    \textbf{engelen} & 1~629 & 15~870 && 23~732 & 15~868 \\
    \bottomrule
   \end{tabular}
  \caption{Details concerning the datasets used for the experiments.}%
\label{tab:example}
\end{table}
Flowcharts

- draw.io (free, simple, all you probably need)
- OmniGraffle (nice, but €€€)